(traduzione in italiano in fondo all'articolo)
How can we abandon coal, oil, and gas? Is it a realistic goal? How long will it take? How much will it cost? How renewable are “renewable” sources, really? Do they work? How much of those do we need?
These
questions appear simple. However, the answers are rather complex. Everything is
complex when you are 7 billion people.
We can
start to address these questions based on two guiding ideas:
1) Humanity depends excessively on
energy produced burning fossil fuels.
2) The reason why this dependence is
toxic is the following: intensive coal and hydrocarbons burning causes
pollution, global warming, and destruction of natural resources at an unsustainable
rate.
These two
points have so far been proven by countless studies and scientific papers and
they are not discussed here.
If you are
reading this and you disagree with these base ideas, maybe the information we
will review will help you updating your knowledge. Or maybe this is simply not
your cup of tea.
So, how do
we “decarbonize”?
I guess we need to start looking at the facts. How much
energy we use, and which kind of energy?
First chart: how much energy. Here’s a chart showing how
energy consumption has evolved in 40 years around the world. The data source is
the EIA (the US
Energy Information Administration).
Instead of a single curve with the world consumption, they
have split the energy consumption by continents (their database also shows country
by country figures).
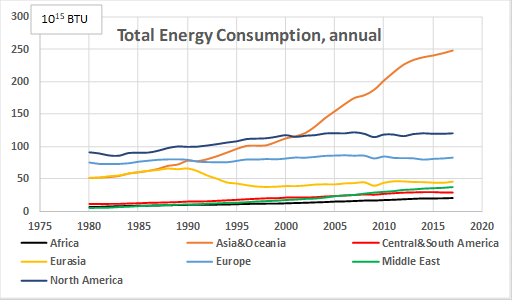
The overall figure (presented in Quads, which are equivalent
to 1015 BTUs) shows that, in 40 years, global energy consumption has
grown constantly and, by now, doubled. It only dropped twice: in the period 1991-1992,
during the collapse of the soviet system, and in 2009, during the global financial
crisis. What is happening now, with Covid-19, will certainly be the third drop,
but the 2020 data are not available yet, of course.
Today we are just short of 600 Quads of global, yearly
energy usage. Corresponding to 130 thousand TWh (Terawatt hour) per year, if
you are more comfortable with the metric system (It’s still too big a number to
appreciate anyway).
If we look at the overall continental trends, we see a clear
one: most continents or regions show, over time, a stable, progressively
growing energy consumption, with some exceptions:
Eurasia (Russia plus Caucasus and central Asia): due to the
mentioned collapse of the communist political system.
Asia, or, mainly, China and India, with a rather steep growth.
The double-digit yearly growth these two economies had in the past twenty years
feeds off large amounts of energy. Mostly coal, at least in the first part,
being abundant and cheap. We will see in the next chart what happened when the Chinese
government realized that it was becoming impossible to breathe, in their fast-growing
cities.
Europe and north America are the slowest-growing energy
users. Not surprisingly, since these regions were already strongly developed before
1980.
So now that we have an idea, or a confirmation on how much
energy we use, let’s have a look at which sources it is coming from.
The chart below shows the global energy consumption in the
past 50 years, broken down by the main sources of energy.

The chart is available online in a BP paper from 2019: BP
energy review 2019 .
It is another simple chart which shows two main things:
Fossil fuels are still dominant. Despite progress, much in
the same way the XX century was actually the century of coal (and the XIX
century was dominated by burning wood), this new century, so far, has been the
century of oil, and will be for a while.
Look at the relative size. We can appreciate how minor is,
globally, the contribution of nuclear and renewables.
We should also note that the overall amount of gas and oil
that we are extracting, as a species, is quantitatively growing every year, despite
the remarkable progress in renewable energy installation.
Two further details:
Oil: within the general growth trend, there are two “slumps”
in the curve, both related to geopolitical issues. The first is the oil embargo
organized by the OPEC countries in 73-74. The second, in 1978, was caused by
the Iranian revolution.
Coal: the acceleration seen from the early 2000’ is largely
due to China’s economic explosion. Similarly, the drop in recent years is
related to China’s government curbing production and shutting down power
stations, with a partial conversion to wind and solar.
So, just to wrap up this first overview, I will try to make
everybody happy.
First, the oil patch. It looks like if the renewable sources
are to take over from hydrocarbons, it’s going to take time. Decades, at best.
Covid economy is the main problem for the industry, not the renewables.
Second, the green energy industry. I have been following its
growth for a good 15 years. Back then, in 2005, it barely showed in the stats.
In fact, removing nuclear and hydro from the green energy account, anything
else was in the zero-point-something realm. But in 15 years the energy produced
and consumed from wind and solar has reached at least 7% of the global output.
It is a phenomenal growth rate. I could show that with a pie chart, but who
needs another pie chart? And investments are going in that direction. So keep
it up, guys.
So everyone should be happy. Except of course many of us are
stuck at home, many have lost their jobs, and a lot of things will never be the
same anymore.
A change in the source of energy, although necessary, will not be sufficient to manage this transformation. Something deeper will need to take place.
Come sta l’energia?
Grandi domande e due grafici facili (per cominciare).
Come possiamo abbandonare carbone, petrolio e gas? E’ un progetto realistico? Quanto tempo ci vorrà? Quanto costerà? E poi le energie rinnovabili lo sono davvero? E funzionano? Quante ne servono?
Queste domande sono semplici. Sono le risposte che sono complesse. Tutto è complesso quando sei in sette miliardi di persone.
Possiamo cominciare a occuparci di queste domande partendo da due idee di base:
1) L’umanità dipende eccessivamente da energia ottenuta bruciando combustibili fossili.
2) La ragione per cui questa dipendenza è tossica è la seguente: la combustione intensiva di carbone causa inquinamento atmosferico, riscaldamento globale e distruzione delle risorse naturali a un ritmo insostenibile.
Questi due punti sono stati fino ad oggi confermati da innumerevoli studi e articoli scientifici, e non sono in discussione qui.
Se state leggendo e non siete d’accordo con queste idee di base, forse le informazioni che forniremo vi serviranno da aggiornamento. O forse, semplicemente, questo non è un articolo che vi può interessare.
Quindi: come si “decarbonizza”?
Direi di iniziare a guardare ai fatti. Quanta energia utilizziamo, e che tipo di energia?
Primo grafico: ecco come il consumo di energia è evoluto nei passati 40 anni nel mondo. La fonte di questi dati è la EIA (the US Energy Information Administration).
Invece di una singola curva con il consumo energetico mondiale, hanno suddiviso i consumi per continenti (nella loro database ci sono anche i consumi dei singoli paesi).
(primo grafico)
I dati (l’unità di misura è il Quad che sono 100 mila miliardi di BTU – British Thermal Unit) mostrano che in 40 anni il consumo di energia globale è cresciuto costantemente e oggi è il doppio del 1980.
In realtà in due occasioni è diminuito: nel periodo 1991-92, con il collasso del sistema sovietico, e nel 2009, quando è scoppiata la bolla finanziaria. Quello che sta accadendo oggi, con il Covid-19, causerà una terza crisi, ma non sono ancora a disposizioni i dati 2020 naturalmente.
Oggi si utilizzano poco meno di 600 Quad all’anno, nel mondo. Il che corrisponde a 130 mila Terawattora all’anno, se preferiamo il sistema metrico (è comunque un numero troppo grande per poterlo apprezzare).
Se guardiamo ai trend dei vari continenti ne vediamo uno dominante: la maggior parte delle regioni mostra un consumo in crescita, progressiva e stabile, con alcune eccezioni:
Eurasia (ovvero Russia, Caucaso e Asia Centrale): a causa del collasso del sistema sovietico menzionato prima.
Asia, o meglio, Cina e India soprattutto, che mostrano una crescita più rapida. Per anni hanno avuto tassi di crescita superiori al 10%, una crescita che si nutre di energia. Soprattutto dal carbone, almeno all’inizio, essendo disponibile in grandi quantità ed economico. Vedremo poi nel prossimo grafico cosa è successo quando il governo cinese si accorse che era diventato impossibile respirare nelle loro grandi città che crescevano furiosamente.
Europa e America sono quelle che crescono più lentamente. Ciò non sorprende dato che queste regioni erano già ampiamente sviluppate prima del 1980.
Quindi, or anche abbiamo un’idea, o una conferma di quanta energia usiamo, diamo un’occhiata alle principali fonti.
Il grafico sottostante mostra il consumo globale di energia negli ultimi 50 anni, diviso per tipo di fonte energetica.
(secondo grafico)
Questo grafico è preso da un documento online di BP pubblicato nel 2019: BP energy review 2019 .
E’ piuttosto semplice e mostra soprattutto due cose:
La prima è che I combustibili fossili sono ancora dominanti. Nonostante i progressi, più o meno nello stesso modo in cui il XX secolo è stato in realtà il secolo del carbone (e il XIX secolo quello della legna come combustibile) il nuovo secolo è stato fino ad ora il secolo del petrolio, e continuerà ad esserlo per un pezzo.
Confrontate le curve. Possiamo capire quanto limitato sia il contributo di nucleare e rinnovabili.
Va notato anche che la quantità totale di gas e petrolio che stiamo consumando aumenta tutti gli anni, nonostante i notevoli progressi nella installazione di fonti di energia rinnovabili.
Altri due dettagli:
Il petrolio: nel trend generale che cresce vediamo due “gradini” in discesa, ambedue legati a problemi geopolitici. Il primo è l’embargo petrolifero dei paesi dell’OPEC nel ’73-’74. L’altro, nel 1978, fu causato dalla rivoluzione in Iran.
Il carbone: l’accelerazione che vediamo nei primi anni 2000 è in larga parte legata alla esplosione economica della Cina. Nello stesso modo, la decrescita in anni recenti è dovuta al governo cinese che ha tagliato la produzione, chiuso centrali, scegliendo una parziale conversione al solare e all’eolico.
Quindi, per riassumere questa prima panoramica, tutti dovrebbero essere contenti.
Per primi, i petrolieri: sembrerebbe che il giorno in cui e rinnovabili sostituiranno il petrolio sia ancora lontano. Decenni, come minimo. Il problema principale dell’industria petrolifera oggi è il Covid-19, non la concorrenza delle rinnovabili.
Poi, l’industria della “green energy”: ho seguito la sua crescita negli ultimi 15 anni. Nel 2005 faceva fatica a comparire nelle statistiche. Infatti, se rimuoviamo nucleare e idroelettrico, tutto il resto messo insieme era nella zona dello zero virgola. Ma in 15 anni l’energia prodotta dal settore rinnovabile è arrivata al 7% della produzione mondiale di energia. Si tratta di una crescita fenomenale. Potrei mostrarla in un diagramma a torta, ma davvero vogliamo usare ancora i diagrammi a torta? E comunque gli investimenti vanno in quella direzione. Qunidi andate avanti così, ragazzi.
Quindi tutti contenti no? Beh, no. Molti di noi sono chiusi in casa, milioni hanno perso il lavoro, e molte cose non torneranno più come prima.
Un cambio nelle fonti di energia è necessario, ma non sarà sufficiente a gestire la trasformazione necessaria. Qualcosa di molto più profondo dovrà cambiare.
Nessun commento:
Posta un commento